Empathy mapping in 2026 is a four-quadrant visualization that captures what users say, think, do, and feel. You build it from real research, not assumptions. In 2026, the method matters more because AI handles data processing while humans own empathy and interpretation (Maze, 2026). Research is now essential to strategy in 22% of organizations, up from 8% in 2025 (Maze Future of User Research 2026). A good empathy map turns scattered interview notes into one shared picture your whole team can act on.
TL;DR
- Empathy mapping organizes user research into four quadrants: Says, Thinks, Does, Feels.
- Build it from interviews and observation, never from guesses.
- Research-led design firms grew revenue 32 points faster over five years (McKinsey).
- AI now drafts the first pass; humans validate the emotional truth.
- Six steps: scope, gather, cluster, fill quadrants, find gaps, decide.
Table of Contents
- What Empathy Mapping Is
- Why It Still Matters in 2026
- The Four Quadrants Explained
- Step-by-Step: Build an Empathy Map
- Empathy Map vs Persona vs Journey Map
- Tools and Resources
- Where AI Fits Now
- Geographic Relevance
- Answer Capsules
- FAQ
- Conclusion
What Empathy Mapping Is
Empathy mapping is the visual representation of a user’s thoughts, feelings, and actions, organized into quadrants. Designers use it to turn raw research into a shared understanding (IxDF, 2026). The map sits on one wall or one board. Everyone sees the same user.
I have run this exercise across enterprise dashboards, banking apps, and government platforms. The pattern repeats. Teams argue less about the user once the map is on the wall. The map becomes the referee.
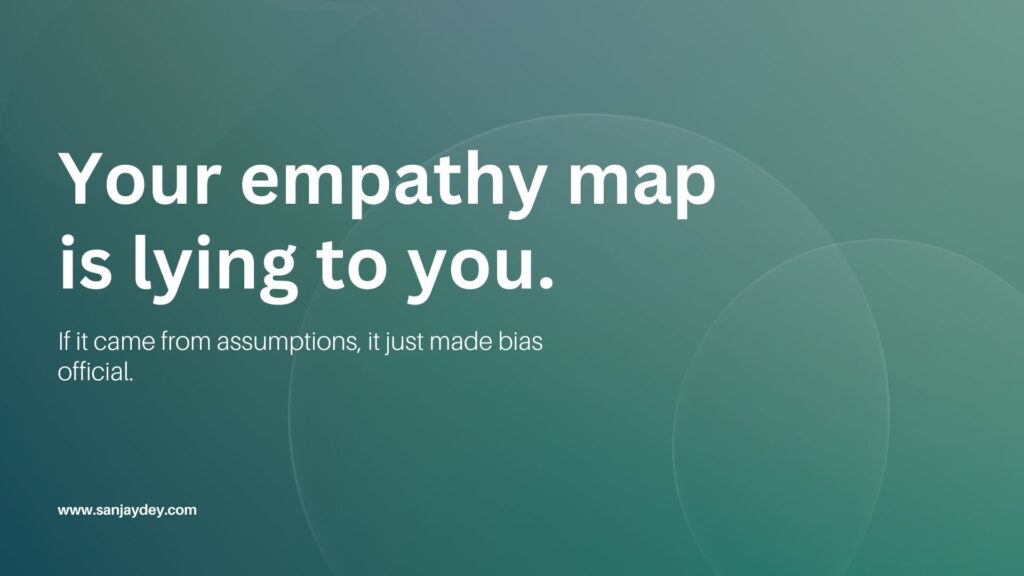
Most teams treat it as a warm-up. That is the mistake. Done from real data, it is the part of the process that catches the assumptions nobody questioned.
Why It Still Matters in 2026
The business case is no longer soft. Every $1 invested in UX returns up to $100, a 9,900% ROI in the strongest cases (Forrester via Maze). McKinsey tracked 300 companies and found design leaders grew revenue and shareholder returns at nearly twice their peers’ rate (McKinsey via Akraya).
Here is the 2026 shift. AI now handles transcription and pattern detection. Humans focus on empathy and interpretation (Maze, 2026). The empathy map is where that human work happens.
There is a risk too. The danger for 2026 is over-relying on behavioral data and missing why users act (Medium, Nov 2025). An AI can optimize a button on click rate while users click out of confusion. The map forces you to ask why. That question is what separates real UX work from analytics dashboards. For more on this tension, see my breakdown of AI in UX design and AI-powered UX research in 2026.
The Four Quadrants Explained
An empathy map is split into four quadrants: Says, Thinks, Does, Feels. Each captures a different layer of the user (IxDF, 2026). Extended versions add Sees, Hears, Pains, and Gains.
Says
Direct quotes from research. What the user actually told you. No paraphrasing.
Thinks
What occupies the user but stays unspoken. You infer this from tone, hesitation, and contradiction. The gap between Says and Thinks is often where the design problem lives.
Does
Observed actions. What the user did during the task, not what they claimed they do. These differ more often than teams expect.
Feels
The emotional state. Frustrated, anxious, confident, rushed. This quadrant carries the most weight and gets the least rigor in most teams.
The value sits in the contradictions. When Says and Does point in opposite directions, you have found something worth designing for. My guide to UX personas for design decisions covers how this feeds persona work.
Step-by-Step: Build an Empathy Map
To build an empathy map, you gather research, cluster observations, fill four quadrants, and identify gaps. The process takes one focused session with real data behind it.
Step 1: Scope the User
Pick one segment. Not “all customers.” Name a specific group: freelance content creators aged 25 to 35 growing audiences through video. One map per segment.
Step 2: Gather Real Research
Use interviews, usability sessions, and contextual observation. Five to eight moderated sessions give enough signal for one map. The earlier you do this, the cheaper the fix. Forrester puts a design-phase fix at $1, a development fix at $5, and a post-launch fix at $30 (Forrester via Akraya, Aug 2025).
Step 3: Cluster the Raw Notes
Pull quotes and observations onto sticky notes. Group similar ones. Patterns surface fast when the team does this together.
Step 4: Fill the Quadrants
Place each note into Says, Thinks, Does, or Feels. Argue about placement. The argument is the work.
Step 5: Find the Gaps and Tensions
Look for contradictions. Look for empty quadrants. An empty Feels quadrant usually means your research skipped emotion. Go back.
Step 6: Decide Something
A map that does not change a decision was a waste of a session. Name one design change it triggers. Then ship it. See my UX audit step-by-step guide for turning maps into fixes.
This works. But only when the research is real. A map built from team assumptions just launders bias into a diagram. That is the part most guides skip.
Empathy Map vs Persona vs Journey Map
The key difference: an empathy map captures one mindset, a persona captures a profile, a journey map captures a timeline. They feed each other, but they answer different questions.
| Artifact | Captures | Best Used For |
|---|---|---|
| Empathy Map | What users say, think, do, feel | Building shared emotional understanding early |
| Persona | Demographics, goals, behaviors | Aligning teams on who they design for |
| Journey Map | Stages, touchpoints, emotions over time | Finding friction across an end-to-end flow |
| Affinity Map | Patterns across many data points | Consolidating large research datasets |
Empathy maps focus on individual experience while affinity maps identify patterns across data (IxDF, 2026). Use empathy maps to understand. Use affinity maps to consolidate. My piece on task flows vs user flows explains where each artifact connects.
Tools and Resources
Figma and Miro ship built-in empathy map templates with drag-and-drop quadrants (Digital AniVi, 2025). For distributed teams, a shared board beats a physical wall. For co-located teams, the wall still wins on energy.
The NN/g empathy map format remains the reference template most teams adapt (Nielsen Norman Group). Start there, then modify for your context. For the wider research workflow, see my advanced UX research guide on ethnographic and contextual inquiry.
Where AI Fits Now
AI changed the input layer, not the judgment layer. A 2026 study used BERT sentiment analysis to auto-classify app reviews into pain points and gains, reaching 98.61% binary accuracy (Nature Scientific Reports, 2025). That automates the first pass of populating a map from review data.
It does not replace the session. AI struggles with qualitative insight from interviews, shadowing, and observation (Medium, Nov 2025). Use AI to draft. Use humans to decide what is true. My take on AI empathy maps and user needs goes deeper on this split.
Geographic Relevance
United States. Research is becoming a company-level capability, with 22% of organizations treating it as essential to all strategy in 2026, up from 8% in 2025 (Maze, 2026). US product teams increasingly embed empathy mapping into discovery sprints rather than running it as a one-off. Demand for user insight rose for 55% of organizations over the past year, outpacing team growth.
United Kingdom. UK enterprises, particularly in banking and financial services, run empathy mapping under heavier regulatory and accessibility pressure. Mapping must account for vulnerable-user states and consent flows. The method here often pairs with WCAG-driven research, since emotional friction and accessibility friction overlap. UK teams lean toward documented, auditable research trails.
UAE / Middle East. Government digital services and banking lead UX maturity in the UAE. Empathy mapping supports Arabic-English bilingual interfaces, where directionality and cultural tone change emotional response. Mapping bilingual user states early prevents costly redesigns. Rapid digital-government rollout makes shared-understanding tools valuable for fast-moving, multi-vendor teams.
Australia / New Zealand. Australian teams in fintech, government, and SaaS favor lean, fast empathy mapping tied to continuous discovery. Compliance with accessibility standards and a strong remote-work culture push teams toward shared digital boards. Mapping is used to align distributed teams on user emotion before sprint planning.
India. India’s UX market was projected near $2.9 billion by 2025 (Procreator via WP Dean). Teams design for extreme device and connectivity diversity, so empathy maps capture context like data cost anxiety and low-bandwidth frustration. Multilingual user states make the Feels quadrant especially rich and especially necessary.
Answer Capsules
What is the main purpose of an empathy map?
An empathy map’s main purpose is to build one shared understanding of a user across a team, drawn from real research. It organizes what users say, think, do, and feel into four quadrants so designers, developers, and stakeholders work from the same picture. This reduces assumption-driven decisions and surfaces emotional friction that analytics alone cannot show. It is most valuable early in discovery, before solutions are committed.
When should you create an empathy map?
You create an empathy map early in the design process, right after collecting qualitative research and before defining solutions. Forrester data shows fixing a usability problem during design costs $1, during development $5, and after launch $30 (Akraya, 2025). Mapping early catches misunderstandings while they are cheap to fix. Late mapping documents decisions already made, which wastes the method’s main strength: changing decisions before they harden.
Does empathy mapping still work in the AI era?
Empathy mapping works better in the AI era because AI handles the slow parts and frees humans for judgment. AI tools now auto-classify review sentiment at over 98% accuracy (Nature, 2025) and draft initial maps from large datasets. But AI misses why users behave as they do. The human-led mapping session validates emotional truth and resolves contradictions between what users say and what they do. The method stays human at its core.
FAQ
What is empathy mapping in UX design?
Empathy mapping is a collaborative visualization that organizes user research into four quadrants: Says, Thinks, Does, and Feels. UX designers use it to gain a shared, deeper understanding of user needs and make better decisions (IxDF, 2026). It turns scattered interview data into one clear picture the whole team can act on during discovery.
How do you create an empathy map step by step?
To create an empathy map, you scope one user segment, gather qualitative research, cluster the raw notes, fill the four quadrants, identify gaps and contradictions, then commit to one design decision. The session works only when fed by real interviews and observation. Maps built on team assumptions just formalize bias instead of revealing user truth.
What is the difference between an empathy map and a persona?
An empathy map captures a user’s mindset in the moment, while a persona captures a stable profile of demographics, goals, and behaviors. The empathy map focuses on what users feel and think; the persona summarizes who they are. Teams often build empathy maps first, then synthesize multiple maps into a persona that guides longer-term design alignment.
What are the four quadrants of an empathy map?
The four quadrants are Says, Thinks, Does, and Feels. Says holds direct quotes, Thinks holds unspoken concerns, Does holds observed actions, and Feels holds emotional states (IxDF, 2026). The most useful insights appear in the gaps between quadrants, especially when what a user says contradicts what they actually do during a task.
Why does empathy mapping improve business results?
Empathy mapping improves results by grounding design in real user emotion, which raises conversion and retention. Design-led companies grew revenue 32 points faster over five years (McKinsey via Parallel), and every $1 in UX can return up to $100 (Forrester via Maze). Mapping catches the misunderstandings that drive abandonment before they reach production.
Can AI replace empathy mapping?
AI cannot replace empathy mapping, but it speeds the input stage. BERT-based models now classify user review sentiment at over 98% accuracy (Nature, 2025), drafting maps from large datasets. AI still struggles with the qualitative judgment from interviews and observation (Medium, 2025). Humans validate emotional truth and resolve contradictions the model cannot interpret.
Conclusion
Empathy mapping in 2026 earns its place when it changes a decision. The four quadrants are simple. The discipline is not. Build the map from real research, argue about the contradictions, and name the design change it triggers.
The numbers back the effort. Research is now essential to strategy in 22% of organizations, and UX investment returns multiples of its cost (Maze, 2026). AI will draft your maps. Your team still decides what is true.
If your product is losing users you cannot explain, an empathy map built on real research usually finds why. To work through this on your own product, book a free UX consultation or explore more UX strategy work on my site.
[ALT: Four-quadrant empathy map diagram showing Says, Thinks, Does, Feels sections filled with user research notes]About the author. Sanjay Kumar Dey is a Senior UX/UI Designer and Digital Strategist with 20+ years of experience across web, mobile, and enterprise analytics dashboards. He has delivered UX strategy and interaction design for global enterprises including ArcelorMittal, Adobe, NatWest Bank UK, and Government of India initiatives. He writes on UX, conversion, and design strategy at sanjaydey.com.
Sources
- Nielsen Norman Group — https://www.nngroup.com/articles/empathy-mapping/
- Interaction Design Foundation — https://www.interaction-design.org/literature/topics/empathy-mapping
- Maze, UX Statistics & Future of User Research 2026 — https://maze.co/blog/ux-statistics/
- McKinsey / Forrester via Parallel — https://www.parallelhq.com/blog/roi-of-ux
- Forrester Consulting via Akraya, Aug 2025 — https://www.akraya.com/blog/how-to-prove-the-roi-of-ux-research-in-2026
- Nature Scientific Reports, 2025 — https://www.nature.com/articles/s41598-025-30729-4
- Medium, UX/UI Trends 2026 (Nov 2025) — https://medium.com/@ashish.devoq/ux-ui-trends-for-2026-the-delicate-balance-between-ai-precision-and-human-empathy-98081503df0e
- Digital AniVi, 2025 — https://digitalanivipracticeb.com/empathy-mapping-in-ux-a-guide-to-empathetic-design-for-2025/
- WP Dean UX Statistics, 2025 — https://wpdean.com/ux-design-statistics/
- Arounda UX Statistics — https://arounda.agency/blog/ux-statistics
Leave a Reply